What is LPPLS
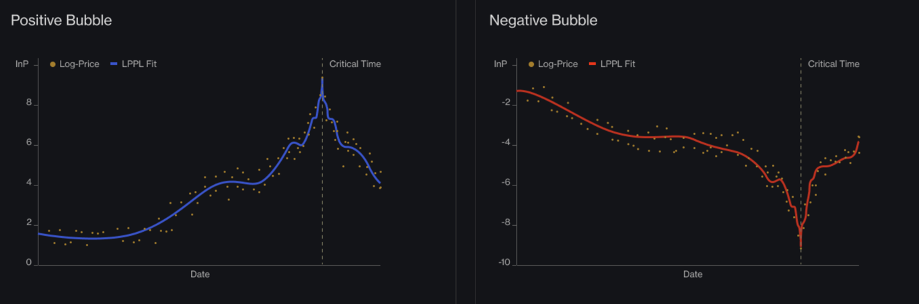
We use the Log-Periodic Power Law Singularity (LPPLS) model to hunt for the distinct fingerprints of Financial Bubbles. Basic assumptions of the model are:
- During the growth phase of a positive (negative) bubble, the price rises (falls) faster than exponentially. Therefore the logarithm of the price rises faster than linearly.
- There are accelerating log-periodic oscillations around the super-exponential price evolution that capture the acceleration of the dynamics of the volatility towards the end of the bubble.
- At the end of the bubble, at the so-called critical time tc, a finite time singularity occurs after which the bubble bursts.
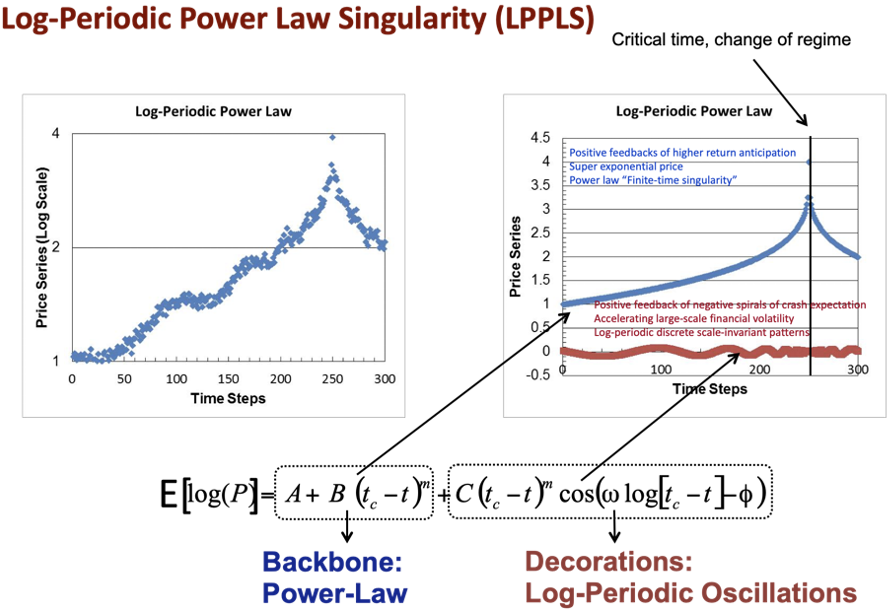
Mathematically, the simplest version of the log-periodic power law singularity model that describes the expected trajectory of the logarithmic price in a bubble is given as
E[log(P)] = A + B(tc - t)m + C(tc - t)m cos(ω log[tc - t] - φ)
The seven parameters describing the model dynamics are:
- A is the expected log-price that will be reached at time equal tc if the bubble develops its full course.
- B controls the amplitude of the log-price change during the bubble. It is negative (resp. positive) for a positive (resp. negative) bubble.
- C controls the amplitude of the log-periodic oscillations. By convention, we take it positive (by adjusting the phase f accordingly).
- f is the phase of the log-periodic oscillations, which controls the characteristic unit of time to measure the distance from present time t to the critical time tc. Geometrically, it controls the translational position of the oscillations.
- tc is the critical time of the end of the bubble, which is close to the peak of the price and beyond which the price correction or crash occurs.
- m is the exponent of the temporal power law controlling the strength of the finite-time singularity. It controls the relative acceleration occurring at the beginning compared with that at the end of the bubble.
- ω is the angular log-frequency of the log-periodic oscillations. It is not a frequency (inverse of a period) but controls the discrete scaling ratio of the log-periodic oscillations according to the formula λ=e^(2π/ω). λ is the ratio between the successively shrinking periods of the oscillations as t increases towards tc.
In order to understand our history, we have to go back before Prof. Dr. Sornette made the first application to finance of his insights on
Building on the physics of heterogeneous and complex systems, Prof. Dr. Sornette has been working interdisciplinarily in financial economics since 1993. He has continuously contributed novel ideas on option pricing and hedging in incomplete markets
The ideas for the log-periodic power law singularity (LPPLS) model developed out of the concepts of self-organization towards instabilities in the presence of positive feedbacks (or “procyclicality”) and the observation that this process would follow a complex overall accelerating pattern until a critical event occurred. It is characterized by the log-periodic power-law singularity equation, as its simplest mathematical expression.
The world is full of many such patterns
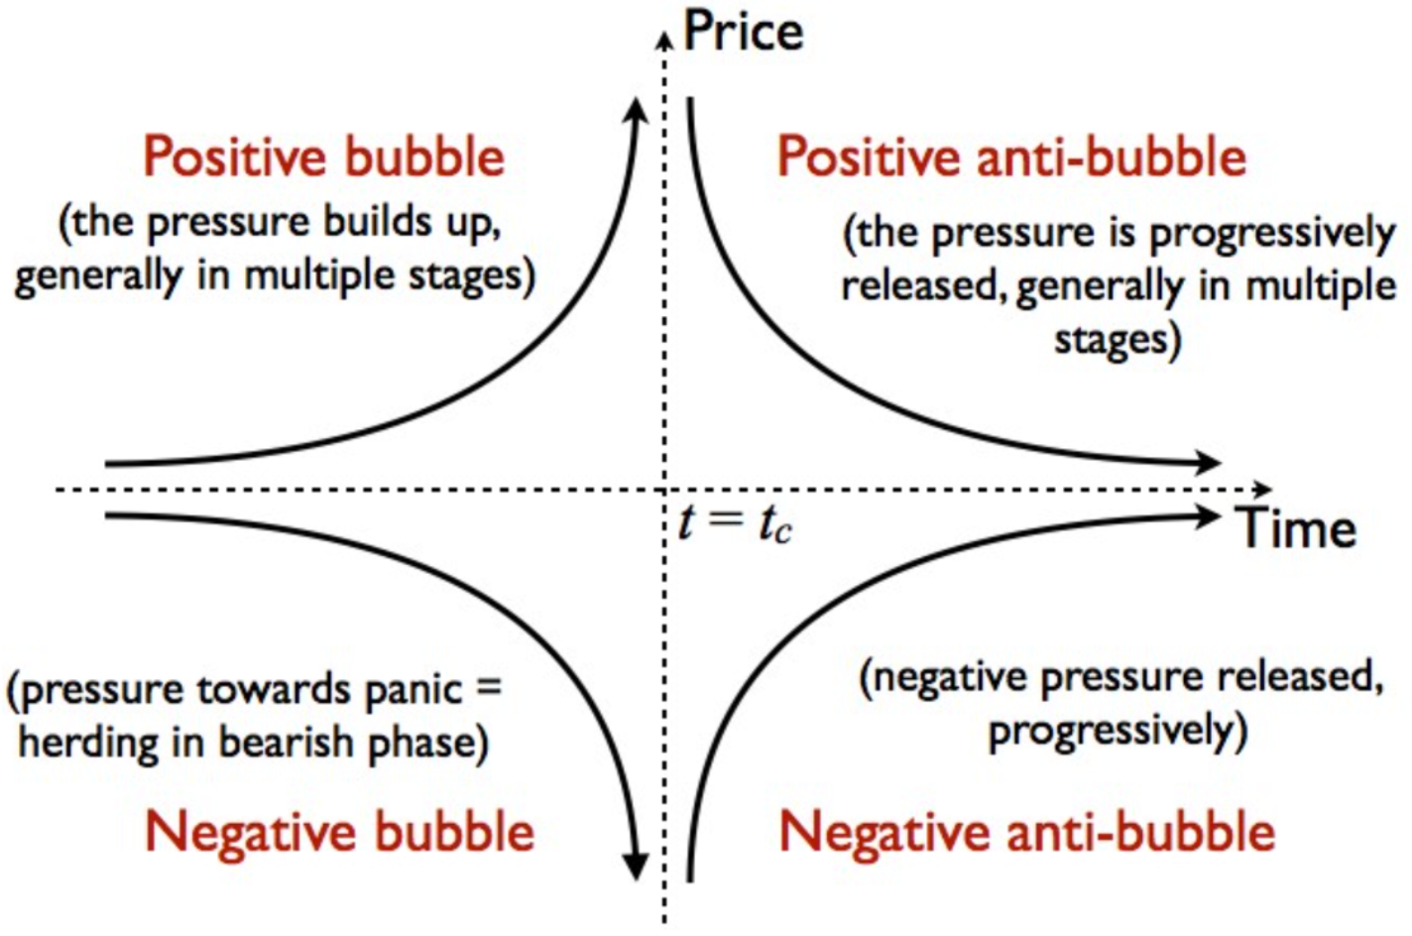
The research of Prof. Sornette and his collaborators has led to the general classification shown in the figure on the right. Most of the examples discussed in this report are of the “positive bubble” type (upper left quadrant). In the sequel, an example of a “negative bubble” is shown, corresponding to the US stock market price dynamics from its peak in Oct. 2007 to its trough in March 2009. “Positive anti-bubbles” have also been studied prospectively by
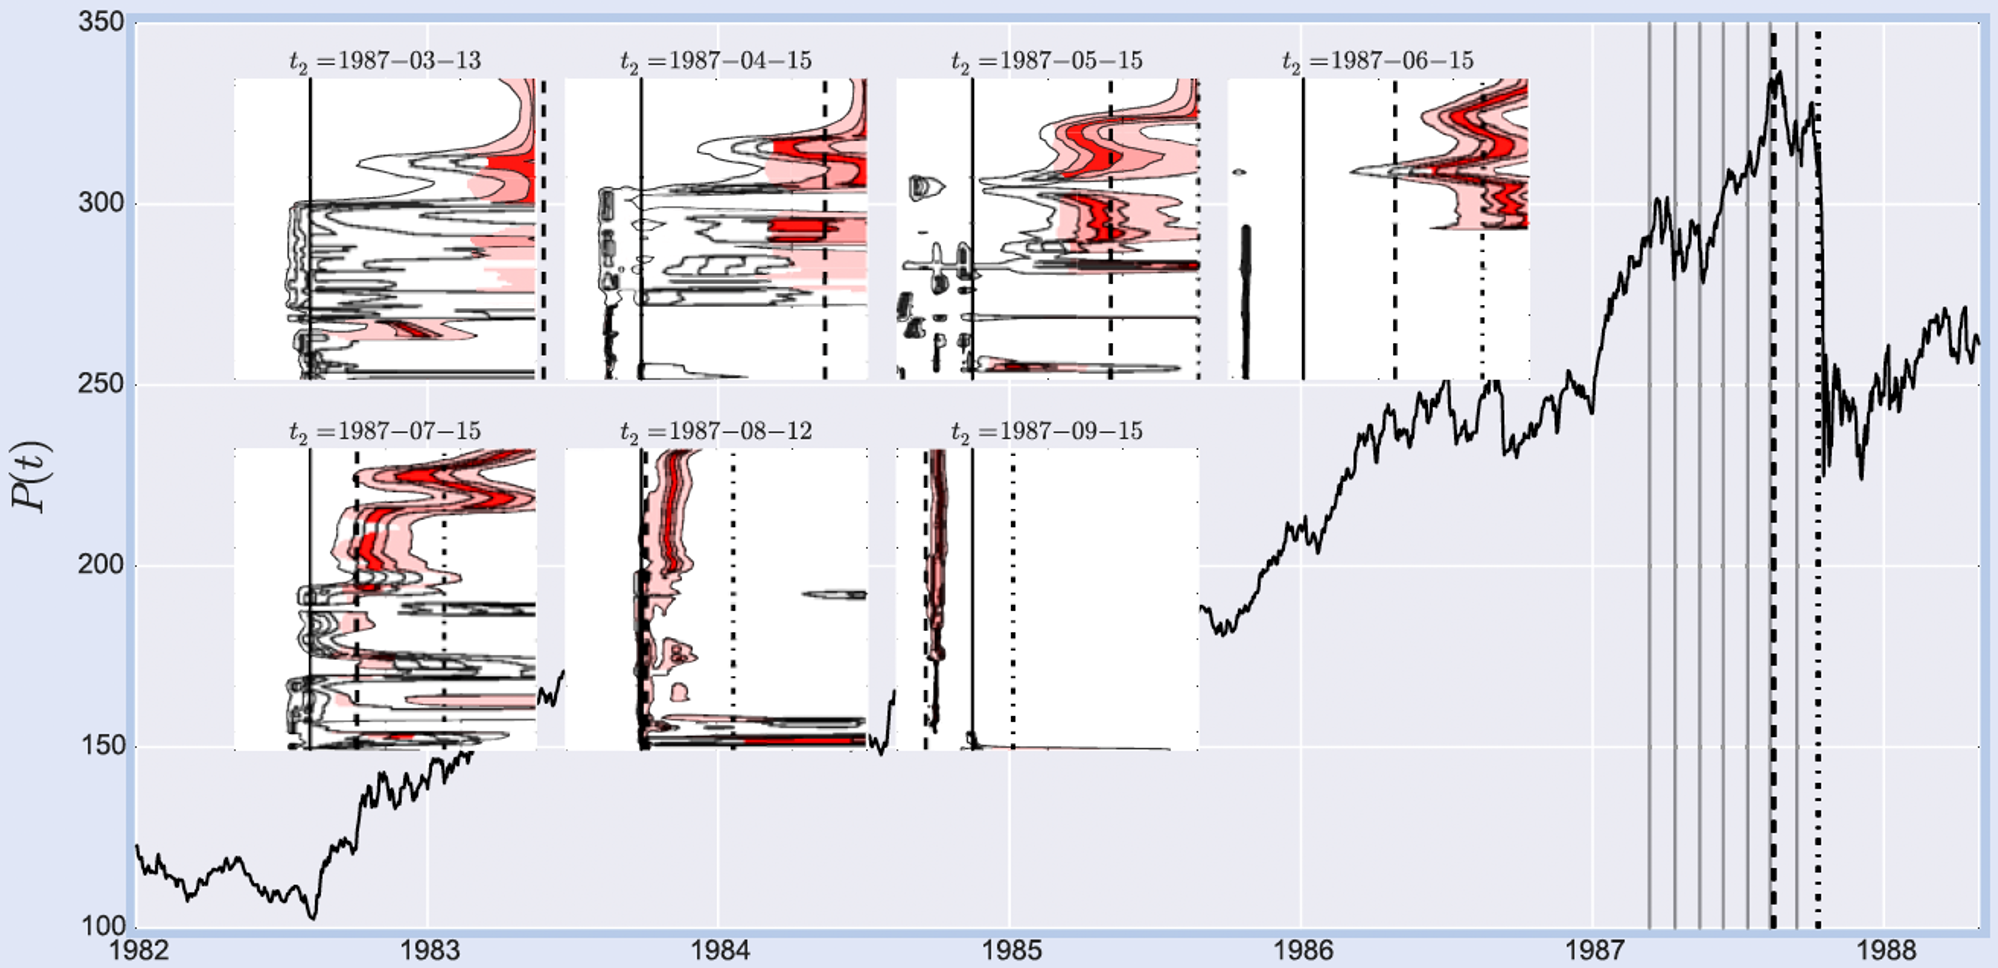
Although Prof. Dr. Sornette had considered financial applications prior to 1996, it was in the summer of 1995 that he noticed this pattern in the behavior of the financial markets. A detailed post-mortem (or retrospective) study of the bubble that bursts with the crash of October 1987 was reported in
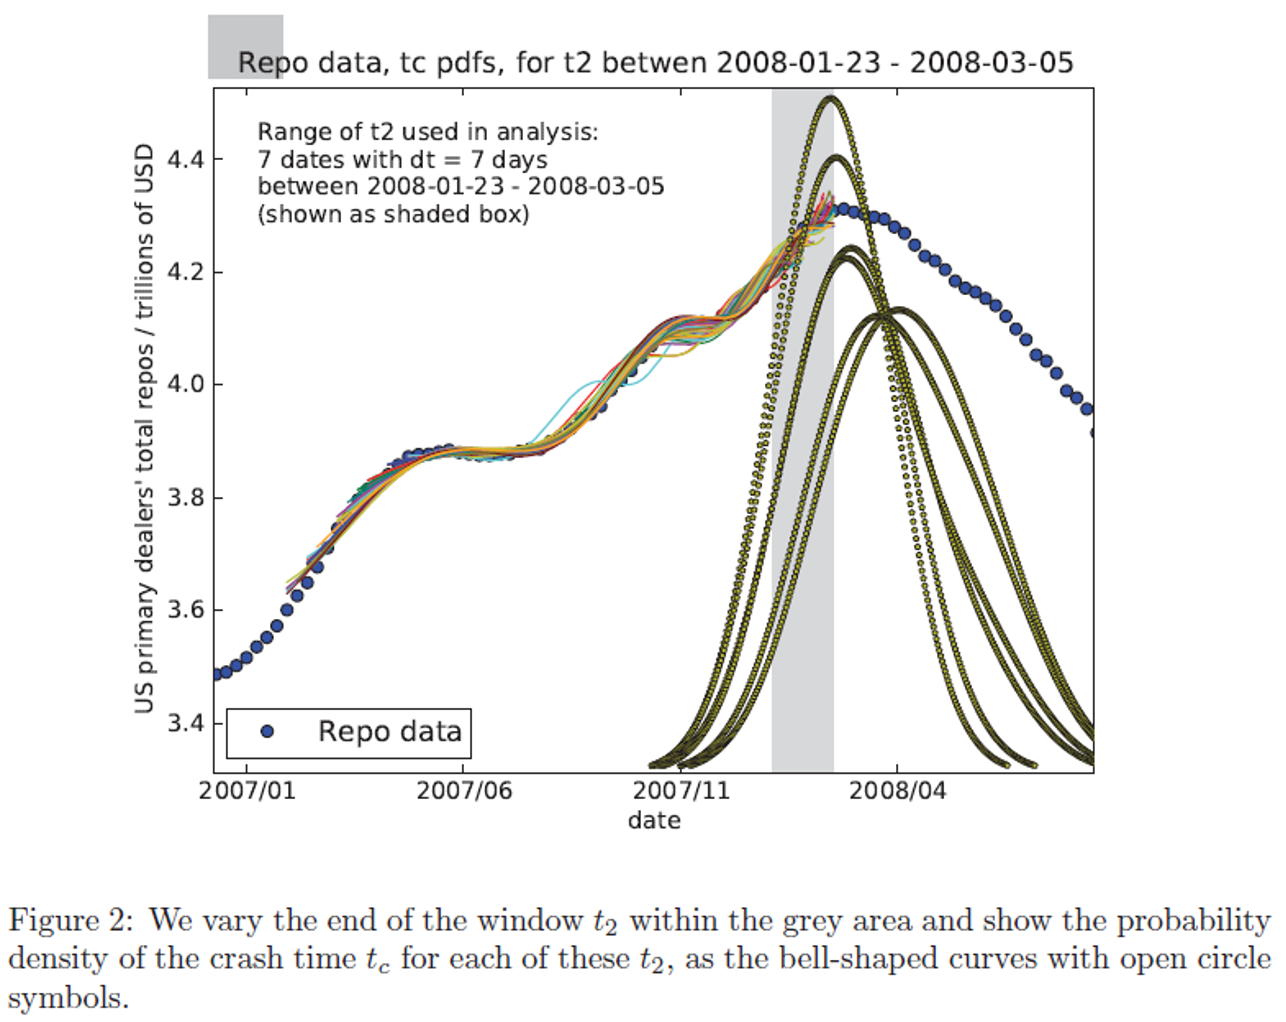
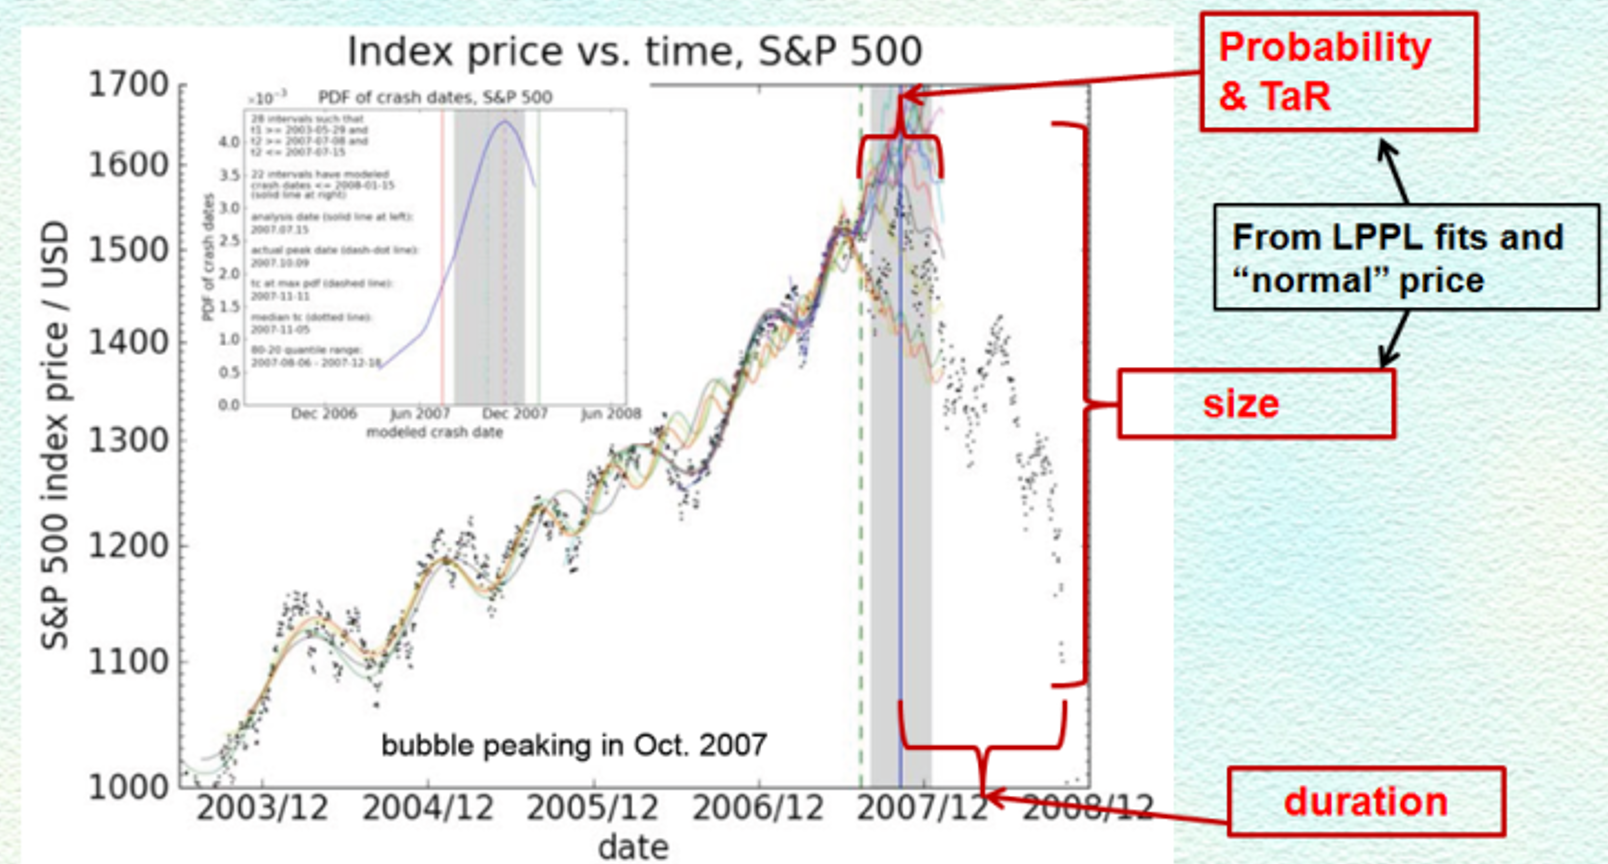
The LPPLS methodology provides probabilistic forecasts of the time of crash also called time- at-risk. This is illustrated in the figure to the right with the LPPLS methodology applied to the diagnostic of the bubble from 2003 to October 2007 and the prediction of its burst after October 2007. The time of the analysis is indicated by the vertical dashed line and corresponds to August 2007. TaR stands for Time-at-Risk and represents that time interval in which the change of regime (crash) is likely to occur (80% probability).
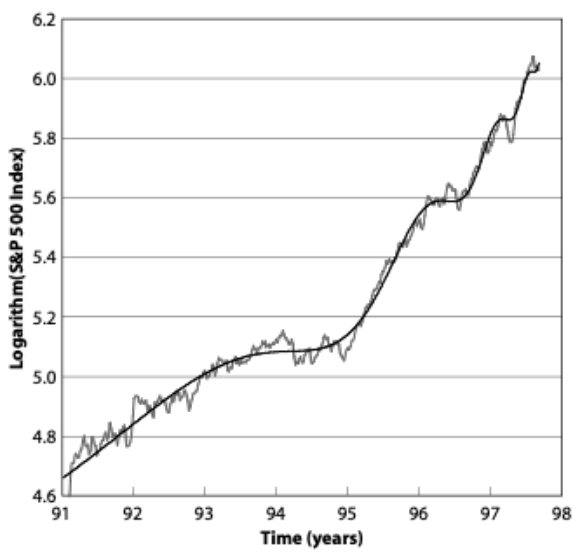
Prof. Dr. Sornette’s first prediction in real-time is that of a crash in October 1997 based on a LPPLS analysis of the bubble developing from 1991 to 1997 (see graph on the right). In order to record officially this prediction, he and his colleague filed a Patent with the French Patent Office on September 17, 1997 that presented the prediction of the October 1997 crash in details. Excerpt from
In fact, the detection of log-periodic structures and a prediction of a stock market correction or a crash at the end of October 1997 was formally issued jointly ex ante on September 17, 1997 by A. Johansen and the current author, to the French office for the protection of proprietary softwares and inventions, with registration number 94781.
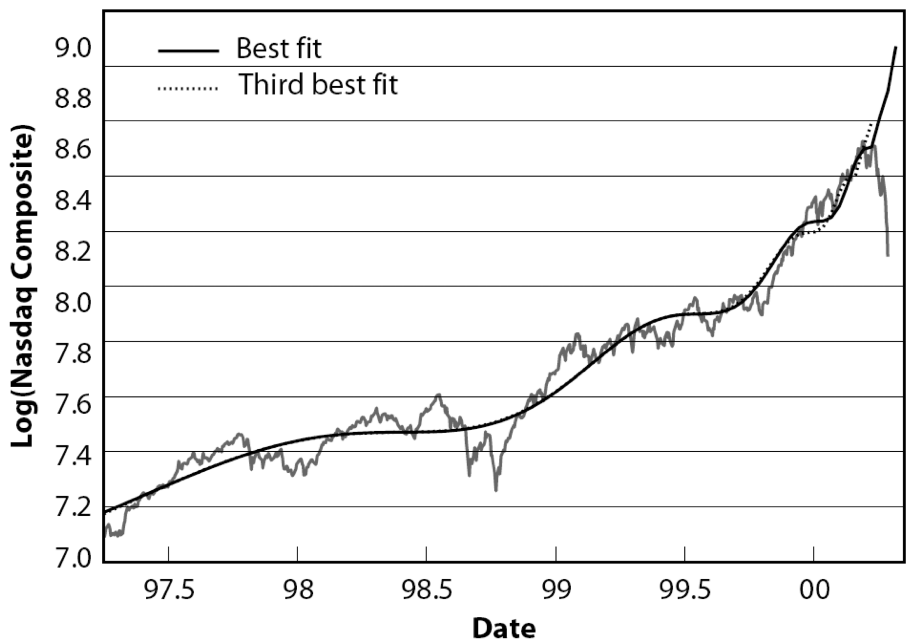
Prof. Dr. Sornette went on to predict the crash ending the Nasdaq dotcom bubble three months in advance as reported later in (Johansen and Sornette, 2000), then several bubbles in China (Jiang, et al., 2010), the oil bubble (Sornette et al., 2009), the real-estate US bubble (Zhou and Sornette, 2006), and others listed below. The figure to the right shows a LPPLS fit to the logarithm of the Nasdaq composite index that crashed in March 2000, illustrating the excellent description of the price dynamics by the model. Excerpt from
The fundamental origin of the crashes on the U.S. markets in 1929, 1962, 1987, 1998, and 2000 belongs to the same category, the difference being mainly in which sector the bubble was created: in 1929, it was utilities; in 1962, it was the electronic sector; in 1987, the bubble was supported by a general deregulation and new private investors with high expectations; in 1998, it was fuelled by strong expectation regarding investment opportunities in Russia that ultimately collapsed; in 2000, it was powered by expectations regarding the Internet, telecommunication, and the rest of the New Economy sector. However, sooner or later, investment values always revert to a fundamental level based on real cash flows.
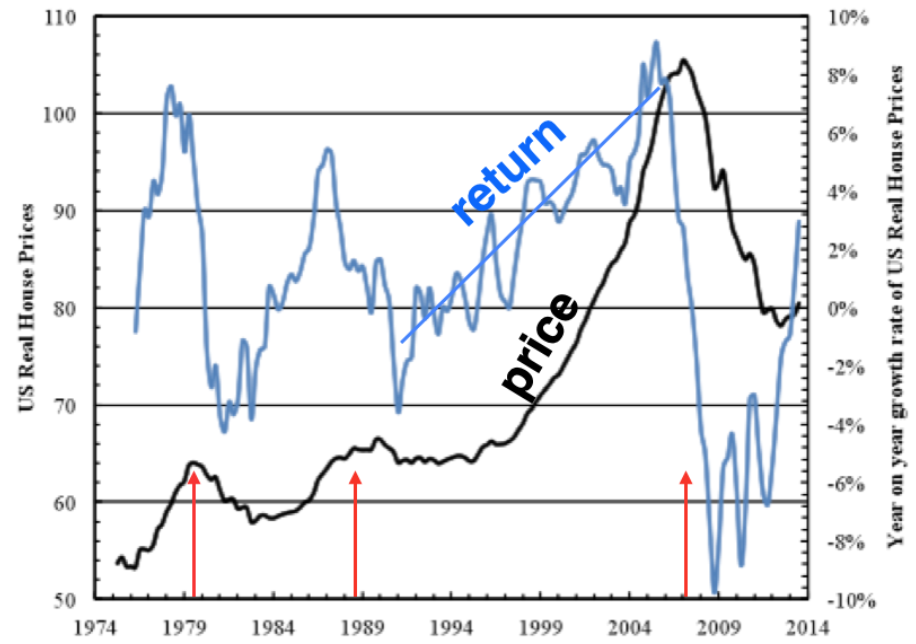
In mid-2005, Zhou and Sornette diagnosed the US housing bubble and predicted the change of regime to occur in mid-2006, about a year in advance (this diagnostic and prediction were presented in June 2005 in the international science archive, arXiv.org). This preprint was subsequently published as
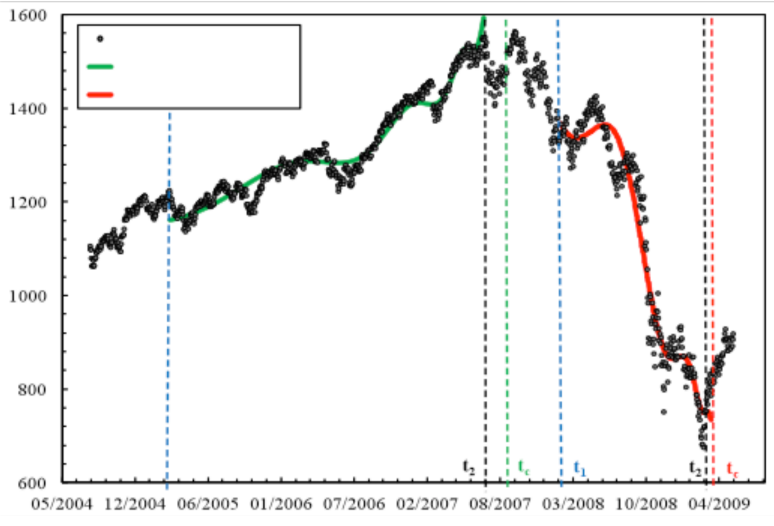
The figure on the right shows a LPPLS fit of the ascending bubble (green) together with a LPPLS fit of the negative bubble (red) representing the spiral of market losses from Oct. 2007 till the bottom on March 2009. Negative bubbles and their “negative crashes”, i.e. rebounds (or rallies), are rarer but statistically easier to predict according to our tests.
Related concepts
Learn how LPPLS connects to Dragon Kings, predictable extreme events and to the research of Didier Sornette.
See LPPLS in action